BPI-R64 (Cortex-A53 @ 1.35GHz, 12.5MHz arch counter), u-blox GNSS 1Hz timepulse. A differential measurement: for every pulse, CPU1 busy-polls the GPIO data register directly (~480ns per MMIO read, counter reads bracketing the detecting read) while CPU0 takes the EINT interrupt with the arch counter value captured at exception entry (entry.S) and again in the pps-gpio hardirq handler. All three captures are raw counter values for the same physical edge, so the pulse's own timing and the pin's input path are common-mode; the deltas isolate the capture mechanisms. The clock was free-running (no hardpps, no NTP) — nothing disciplined, nothing to perturb.
Run on a live Fedora 44 system (full userspace), not an idle test bench.
Load segments: a dnf upgrade (network, mmc I/O, rpm scriptlets)
and loops of dracut --force (compression pipeline). cpufreq
governor as marked; this SoC has no cpuidle driver (idle = WFI at the
governor's frequency).
| segment | capture | mean | p50 | p95 | p99 | p100 | σ |
|---|---|---|---|---|---|---|---|
| idle / performance 118 pulses, 0 excluded | entry.S | +170 | +160 | +400 | +400 | +400 | 133 |
| hardirq handler | +7361 | +7120 | +8880 | +9280 | +10080 | 796 | |
| idle / schedutil 60 pulses, 0 excluded | entry.S | +585 | +640 | +800 | +880 | +960 | 180 |
| hardirq handler | +13652 | +13360 | +17440 | +18080 | +18640 | 1458 | |
| idle / schedutil (post-load) 700 pulses, 3 excluded | entry.S | +584 | +560 | +800 | +960 | +7520 | 360 |
| hardirq handler | +14441 | +13600 | +18720 | +19840 | +35680 | 2538 | |
| load (dracut) / performance 1599 pulses, 17 excluded | entry.S | +413 | +240 | +880 | +2080 | +66560 | 2094 |
| hardirq handler | +11107 | +8880 | +20080 | +25280 | +78160 | 5010 | |
| load (dracut) / schedutil 1722 pulses, 11 excluded | entry.S | +311 | +240 | +800 | +1520 | +14160 | 520 |
| hardirq handler | +11423 | +9440 | +21040 | +24080 | +58000 | 4456 | |
| load (dnf) / schedutil 1086 pulses, 14 excluded | entry.S | +833 | +320 | +1520 | +7760 | +174880 | 5810 |
| hardirq handler | +13079 | +12720 | +20640 | +24480 | +187360 | 7008 |
Exclusions: ~1% of load-segment pulses are excluded where the poll shows the entry stamp predating the pulse by more than 800ns. Those are pulses which arrived while CPU0 was already in an exception taken for an earlier interrupt (the timer tick): the interrupt is serviced from that exception without re-entry, so the entry.S stamp belongs to the tick, not the pulse. The error decays at the crystal-vs-GPS beat rate (~110 ticks/pulse at +8.6ppm) and recurs every ~467s (HZ=250), matching observation. A production entry.S backdate needs a sanity bound against the handler-time snapshot to reject these; the excluded pulses are listed in the run log.
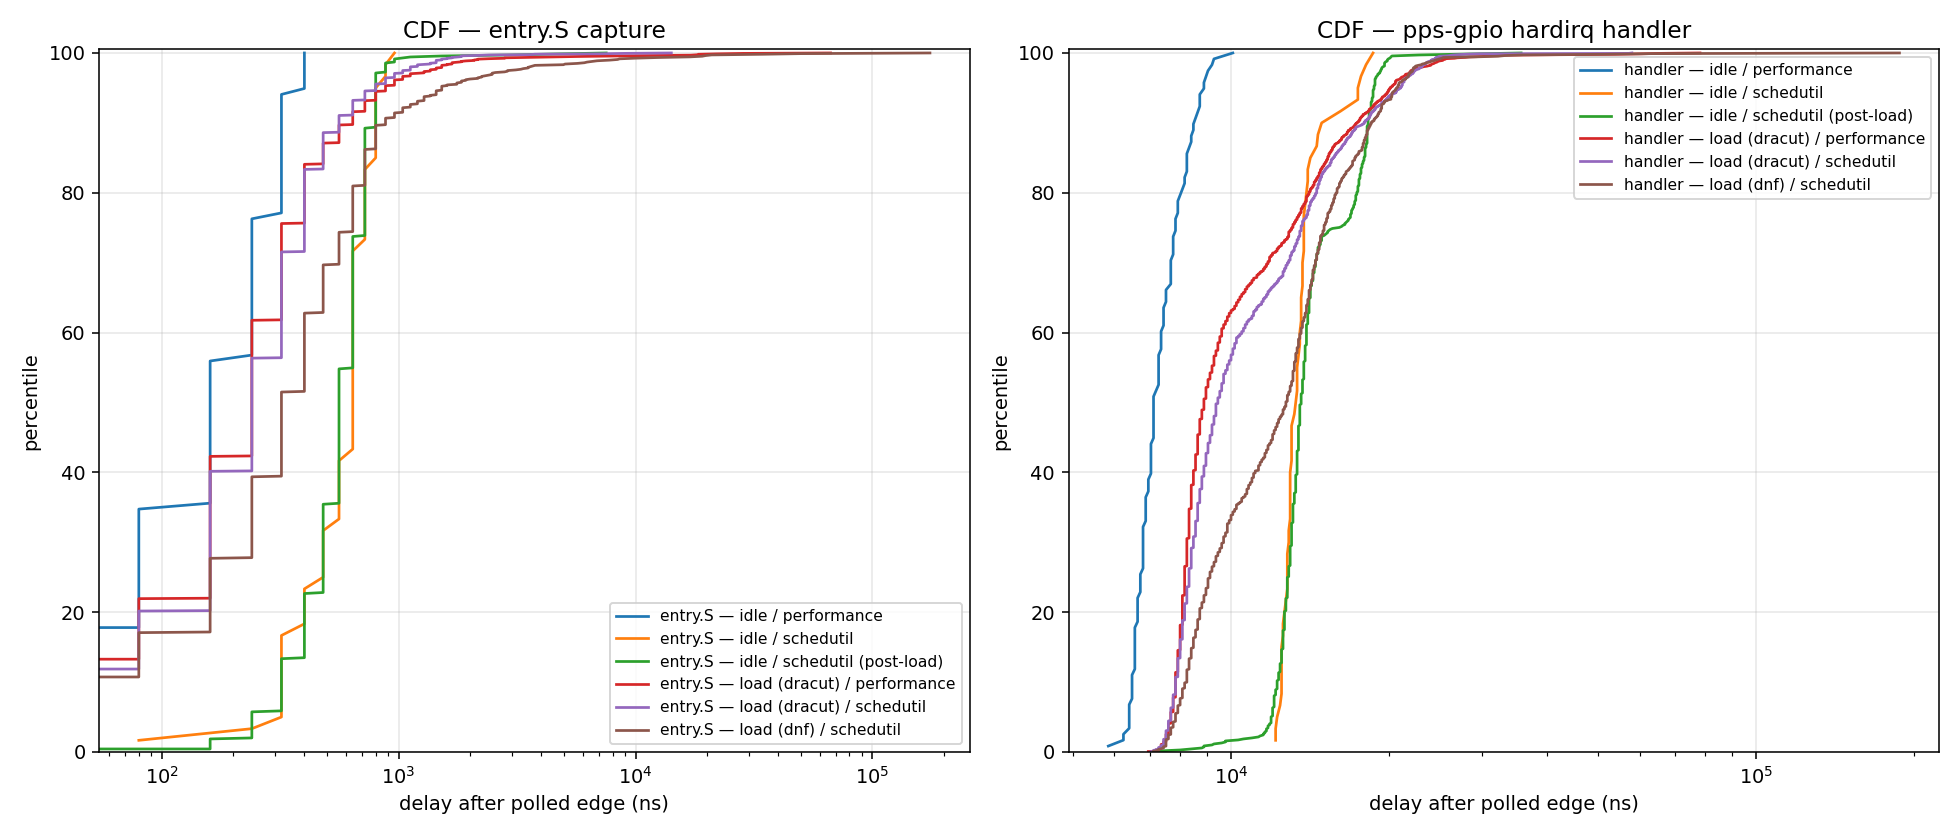
The entry.S body barely moves under load (p50 240–320ns) but grows a smooth heavy tail — there is no knee, so no natural threshold to clip at. The handler timestamp is microseconds at best and its whole body shifts with frequency and load.
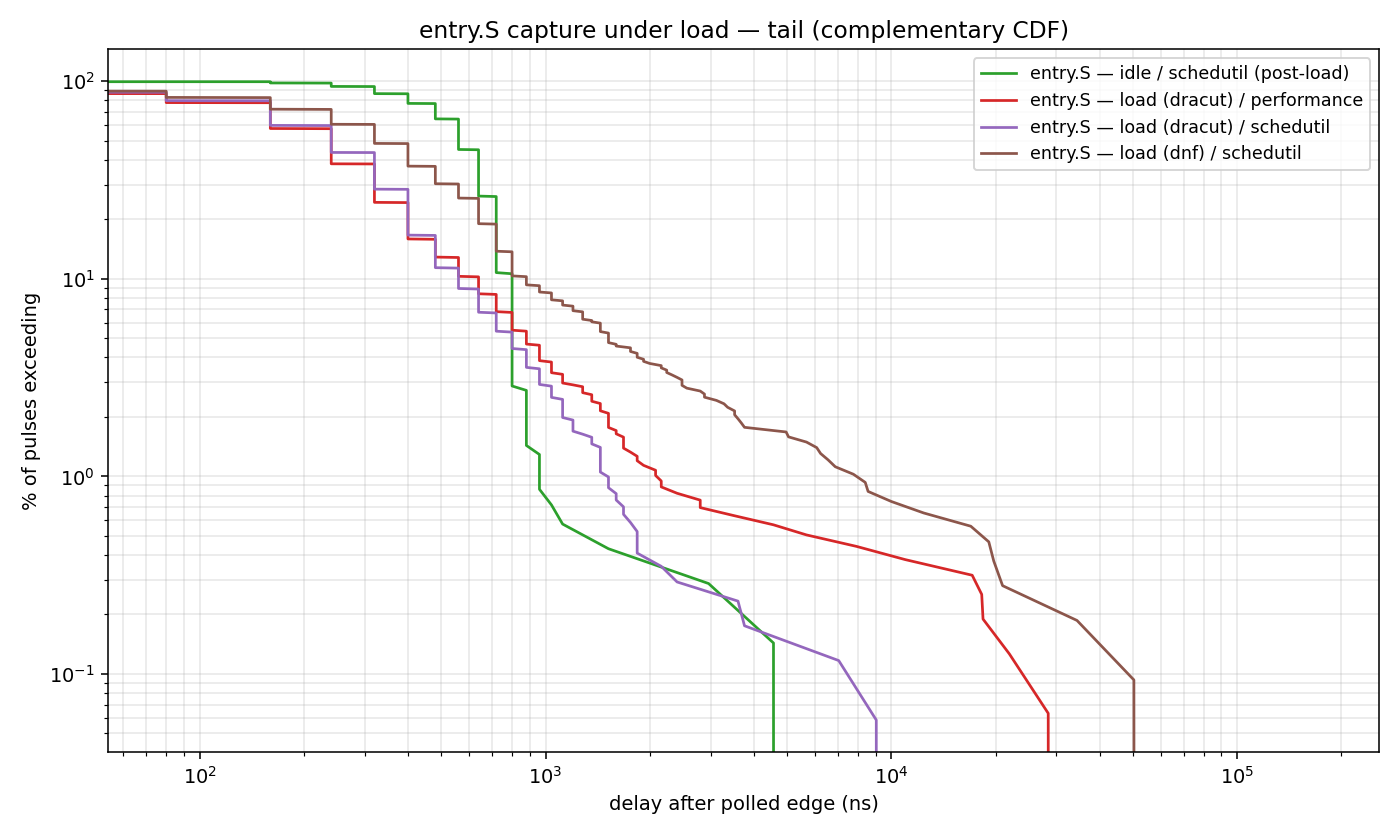
The jitter of the polling method has a physical floor: the edge lands uniformly within one GPIO read period, σ = T/√12 ≈ 140ns for the 480ns direct-MMIO loop (~1.5× that via gpiolib). The loop period stretches ~10–15% under load (bus contention on the MMIO read, visible per-pulse as the bracket width) and with CPU frequency, but that is the poll's entire load sensitivity — it holds the CPU with interrupts off, so a pulse is either captured at floor quality or (if the wake loses the race) simply missed. Its jitter is its floor. The entry.S capture has no such floor — idle, its intrinsic jitter measures below the poll's quantisation — but under load it grows a heavy tail of delayed and mis-attributed stamps.
Method: a smoothed ideal pulse train, built retrospectively from the poll's captures only (leave-one-out local linear fit, ±128 pulses, worst-10% trimmed), plus a short local median of the poll residuals subtracted from both methods to remove crystal thermal wander (strongly autocorrelated, lag-1 r≈0.97 under load: frequency motion the servo tracks, not capture jitter — without this step it inflates both methods' σ several-fold and masks the real comparison). The reference inherits a few tens of ns of the poll's own quantisation, which lands on the entry residuals in quadrature: the construction slightly flatters the poll, not the irq path. Mis-attributed stamps (entry predating the polled edge by >800ns; the tick-shadow episodes above) are gated per-sample — they arrive in runs at the crystal-vs-tick beat, which no fixed-length median survives, but each is individually detectable in a real deployment from the entry→handler gap. A median-of-5 then eats the residual isolated delays:
| segment | capture | σ | p50 | p95 | p99 | worst |
|---|---|---|---|---|---|---|
| idle / performance 118 pulses, 0 gated | poll (spin) | 179 | +11 | +337 | +360 | 375 |
| entry.S raw | 80 | +175 | +295 | +360 | 372 | |
| entry.S, gated + median-of-5 | 49 | +174 | +262 | +264 | 264 | |
| load (dracut) / schedutil 1722 pulses, 11 gated | poll (spin) | 154 | +2 | +249 | +347 | 597 |
| entry.S raw | 511 | +239 | +755 | +1520 | 14273 | |
| entry.S, gated + median-of-5 | 123 | +238 | +507 | +680 | 1051 | |
| load (dnf) / schedutil 1086 pulses, 14 gated | poll (spin) | 155 | -2 | +252 | +338 | 444 |
| entry.S raw | 5814 | +316 | +1613 | +8442 | 175019 | |
| entry.S, gated + median-of-5 | 280 | +311 | +740 | +969 | 3632 |
The poll measures σ ≈ 135–155ns in every segment — load-invariant at its quantisation floor, as the structural argument predicts. The entry.S capture spans σ ≈ 50–70ns (idle, raw — genuinely below the poll's floor) through ≈120ns (moderate load, filtered) to ≈280ns (irq-heavy load, filtered — the dnf tail is dense enough that some of it survives a 5-tap median). So: better than polling when the system is quiet, comparable under moderate load, and ~2× worse under irq-heavy load even after gating and filtering — and it requires the per-sample attribution gate to be usable at all.
The run-structured mis-attribution class would disappear structurally if the counter were stamped per-interrupt at the GIC acknowledge (IAR) read rather than once per exception entry — the dispatch loop can service several interrupts from one exception, and the stamp's granularity is currently coarser than the attribution the hardware provides.
readl of the MT7622 GPIO DIN register
(no gpiolib in the loop), ~480ns sampling period at 1.35GHz; capture is the
midpoint of the counter reads bracketing the detecting read (bracket width
p50 ~6 ticks = 480ns, i.e. uncertainty ±240ns).pt_regs; the pps-gpio handler compares it against the spin
side's published capture (seqcount-protected) and emits one line per pulse.pps-gpio-spin mode 3 on the
r64-bench branch
(TEST HACKS, not for merging), kernel 7.3-rc1 + the posted timekeeping fixes.